Betting Odds Comparison in Global Markets: Key Insights for 2026
Casey Coleman · Nov 21, 2026

Betting Odds Comparison in Global Markets: Key Insights for 2026
Betting odds comparison involves evaluating prices across multiple operators to identify where value emerges on specific outcomes, and this practice has grown more structured as platforms expand their offerings in football, tennis, and horse racing. Data from the Australian Gambling Research Centre shows that bettors who systematically review odds lines achieve measurable differences in returns over time because margins vary between providers by fractions of a percent on popular markets. Those differences compound when larger stakes or frequent bets enter the equation, which explains why dedicated comparison services continue to attract users who track live movements and pre-match lines alike.
Core Elements of Effective Odds Comparison
Operators set odds based on probability models, market liquidity, and risk exposure, yet the final numbers often diverge because each firm applies its own margin structure and adjusts for incoming liability. Observers note that decimal odds, fractional odds, and American odds formats all represent the same underlying probability but require conversion to allow direct comparison across regions. A bettor reviewing a football match might see one platform offering 2.10 on the draw while another lists 2.05, and the gap becomes clearer once both convert to implied probabilities that account for the operator's built-in edge. Researchers at the University of Nevada, Las Vegas have documented how these small variances create opportunities when aggregated across dozens of events, particularly during periods of high betting volume such as November 2026 when international fixtures overlap with domestic leagues.
Regional Variations and Regulatory Influences
Markets in Australia, Canada, and parts of Europe display distinct patterns in how odds respond to information flow because local regulations shape the range of permitted products and the speed of line adjustments. The New Jersey Division of Gaming Enforcement publishes regular reports that track average margins on major sports, revealing that basketball totals often carry tighter spreads than niche tennis props due to higher trading volumes. Bettors who compare across borders therefore encounter different baseline prices even on identical events, and the ability to move between licensed operators in multiple jurisdictions adds another layer to the process. Data indicates that platforms with lower overheads sometimes post sharper numbers on high-profile matches, whereas larger firms maintain broader menus that include less liquid side markets where discrepancies widen.
Practical Tools and Data Sources
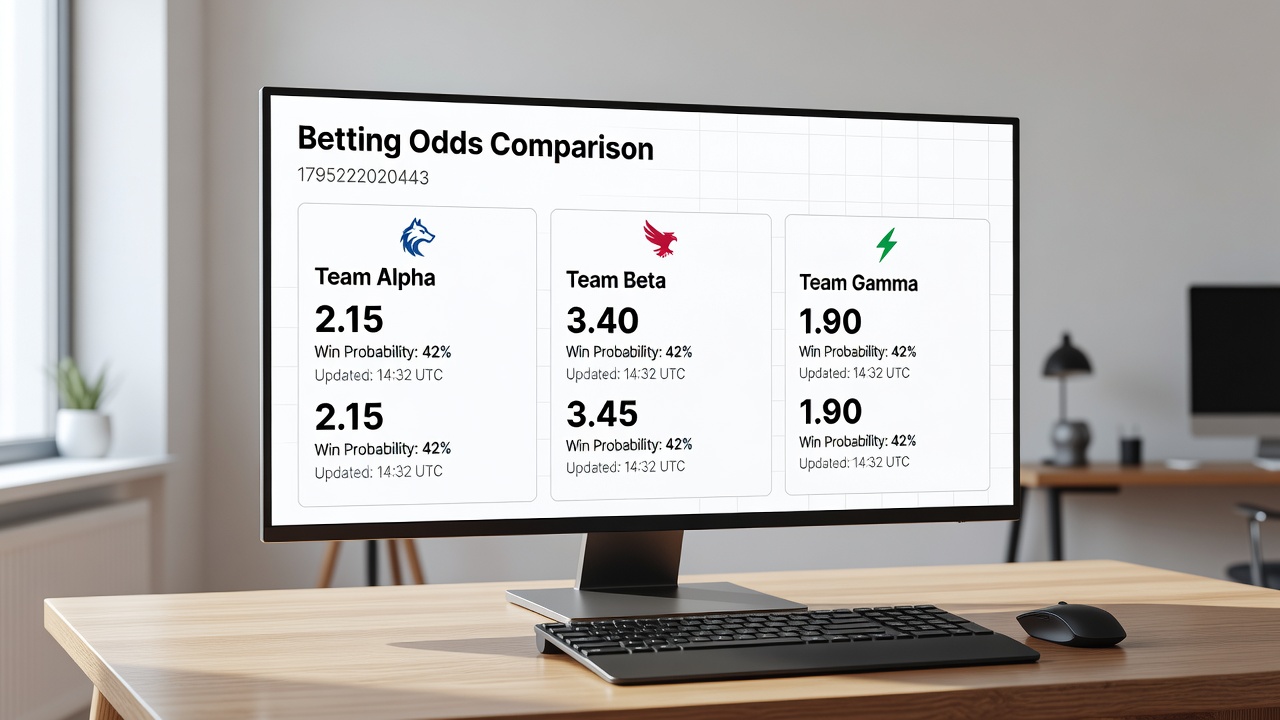
Comparison websites aggregate live feeds from dozens of operators and display them side by side, allowing users to filter by sport, league, and market type without manual checking. These services pull data through APIs and refresh at intervals that capture rapid shifts during live play, which proves especially useful in cricket and basketball where in-play lines move quickly. Industry reports from the Victorian Responsible Gambling Foundation highlight that users who rely on such aggregators tend to place bets at prices closer to the best available across the market, although the foundation also notes that access to multiple accounts remains a prerequisite for acting on those differences. Advanced users sometimes build custom spreadsheets that pull historical odds data to identify which operators consistently lead or lag on particular event types, creating a record that informs future decisions rather than relying on single snapshots.
Impact on Accumulator and Multi-Bet Strategies
Accumulator bets multiply small price advantages because each leg contributes to the overall return, and even a 0.05 improvement on three or four selections can shift the final payout noticeably. Studies from academic researchers in Canada demonstrate that when bettors select the highest available price for each component of a multi, the combined odds exceed those offered by any single operator in most cases. This holds true across football goalscorer markets, horse racing place markets, and tennis set betting, where liquidity differs and some platforms shade lines more aggressively than others. The process requires monitoring several sites simultaneously, yet the arithmetic remains straightforward once the best prices are identified and combined.
Trends Observed in Late 2026
By November 2026, integration between comparison tools and mobile applications had advanced to the point where push notifications alert users when a tracked line moves beyond a preset threshold. Regulatory updates in several jurisdictions introduced new disclosure requirements around margin calculations, which in turn made public data sets more granular and easier to incorporate into comparison routines. Those changes coincided with expanded coverage of emerging leagues in Asia and South America, where odds discrepancies sometimes appear larger because fewer operators maintain deep liquidity on those fixtures. Observers tracking these developments report that the core principle of comparing prices before committing funds continues to underpin any systematic approach regardless of the sport or timeframe involved.
Conclusion
Betting odds comparison functions as a methodical process that draws on publicly available prices, conversion formulas, and historical patterns to locate better value across operators. The practice remains consistent whether applied to pre-match football lines or in-play tennis markets, and the availability of aggregated data has made the steps more accessible. Figures from multiple regulatory bodies confirm that margins differ enough between providers to reward consistent comparison, provided users maintain accounts with several licensed platforms and monitor movements in real time.